PROJECT: EzWatchlist
This document is to document my contributions to the desktop application EzWatchlist.
Overview
EzWatchlist is a desktop application where the user can systematically record down what movie/TV series he/she wants to watch or has watched. It is developed by a group of 5 NUS Computer Science students for the software engineering course based on the Addressbook level 3 codebase provided. One specification is that the user prefers command line interface (CLI), hence the CLI in the application. However, we also implemented a graphical user interface (GUI) created with JavaFX. The project is written in Java.
Summary of contributions
Major enhancement:
Changed the GUI to better suit EzWatchlist
-
What it does:
-
Structures the features into 4 tabs and links them together with the main logic which allows the user to easily navigate around the tabs and execute commands.
-
Ensures that each visible component is displayed with an appropriate size, appearance, space and position.
-
Enhances user experience through user-friendly layout and placeholder text and loading signs to keep the user informed.
-
Enhances user experience through a creative theme.
-
-
Justification:
-
This feature improves the product significantly because a user would like to use an application that is user friendly and has an appealing appearance.
-
-
Highlights:
-
This enhancement requires deep understanding of both the implementation of the application itself and also how to use javafx flexibly in order to effectively communicate between the user and the application and present the message in a desirable manner. It also requires repetitive adjustments and testing of the appearance of the elements to produce a final result.
-
Minor enhancement:
Added a Statistics feature that reflects the user’s personal preferences.
Code contributed:
Code contributed can be found here: [My Code Contribution]
Contributions to the User Guide
Given below are sections I contributed to the User Guide. They showcase my ability to write user documentation targeting normal application users in a clear and understandable manner. |
User-Interface
The UI consists of three parts: sidebar, command bar and various pages that could appear in the main panel. The following sections introduce these UI parts in details.
Sidebar
EzWatchlist gives users the ability to navigate easily through the Watchlist, Watchedlist, Search page and Statistics pages through the use of the side bar at the left of the main page of the graphical user interface. Moreover, keyboard shortcuts 1, 2, 3, 4 bring you to each page respectively.
Note: If user has selected the command box, type 1, 2, 3, 4 and enter to bring you to each page respectively.
Command bar
Users input commands in the command bar and any feedback will be displayed below the text area of command bar.
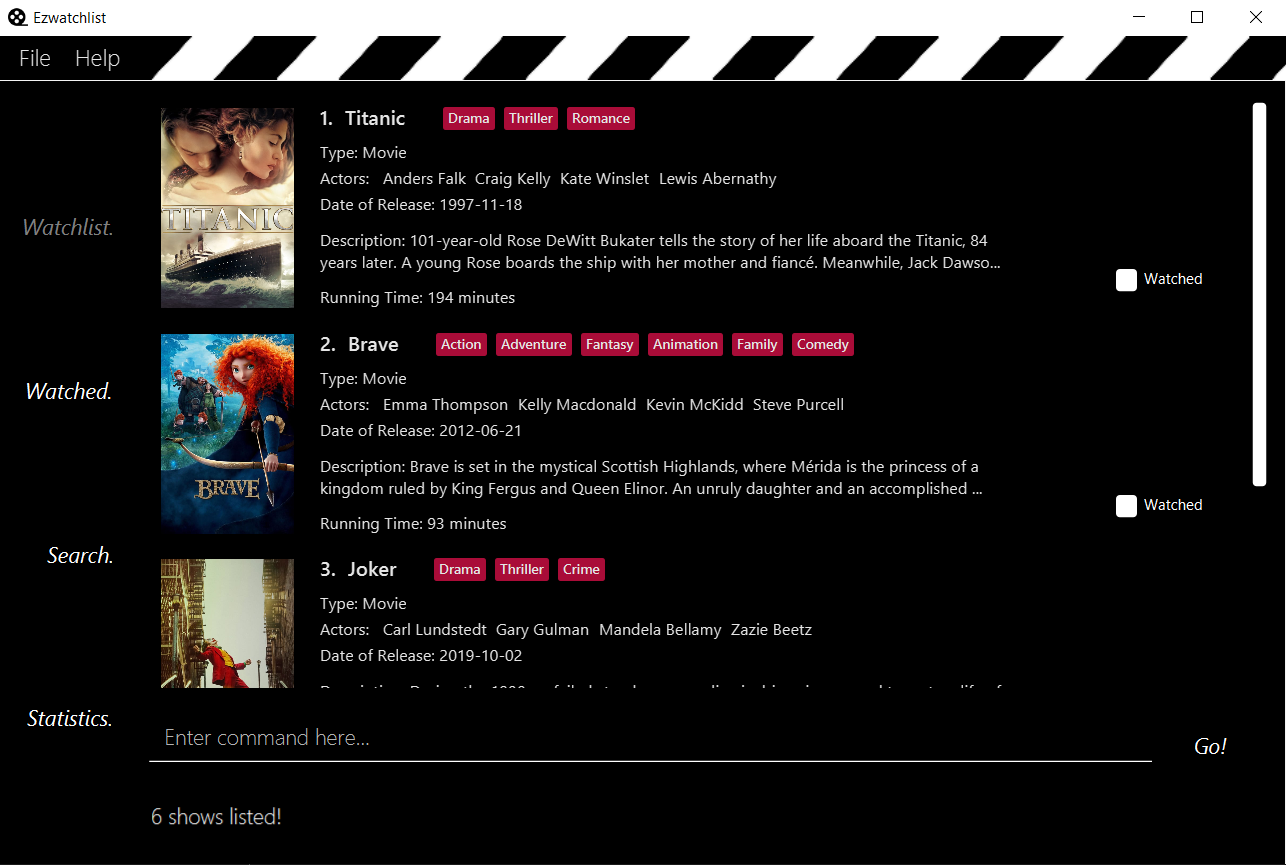
Watchlist Page
The watchlist page is the default page that is opened upon start-up of EzWatchlist.
It shows the user’s unwatched movies and television series.
The user can navigate to this list by clicking the “Watchlist” tab on the side bar or by using the keyboard short-cut 1.
Characteristics of the watchlist page:
-
Movie/TV show poster
-
Name of show
-
Genres
-
Actors
-
Description of the show
-
Running Time
-
Last watched episode (For TV series that have been updated using the
watchcommand) -
Checkbox to indicate if the show has been watched
Watched List Page
The user has the option to view the list of shows that have been marked as watched in the watched list. The user can navigate to this list by clicking the “Watched” tab on the side bar or by using the keyboard short-cut 2.
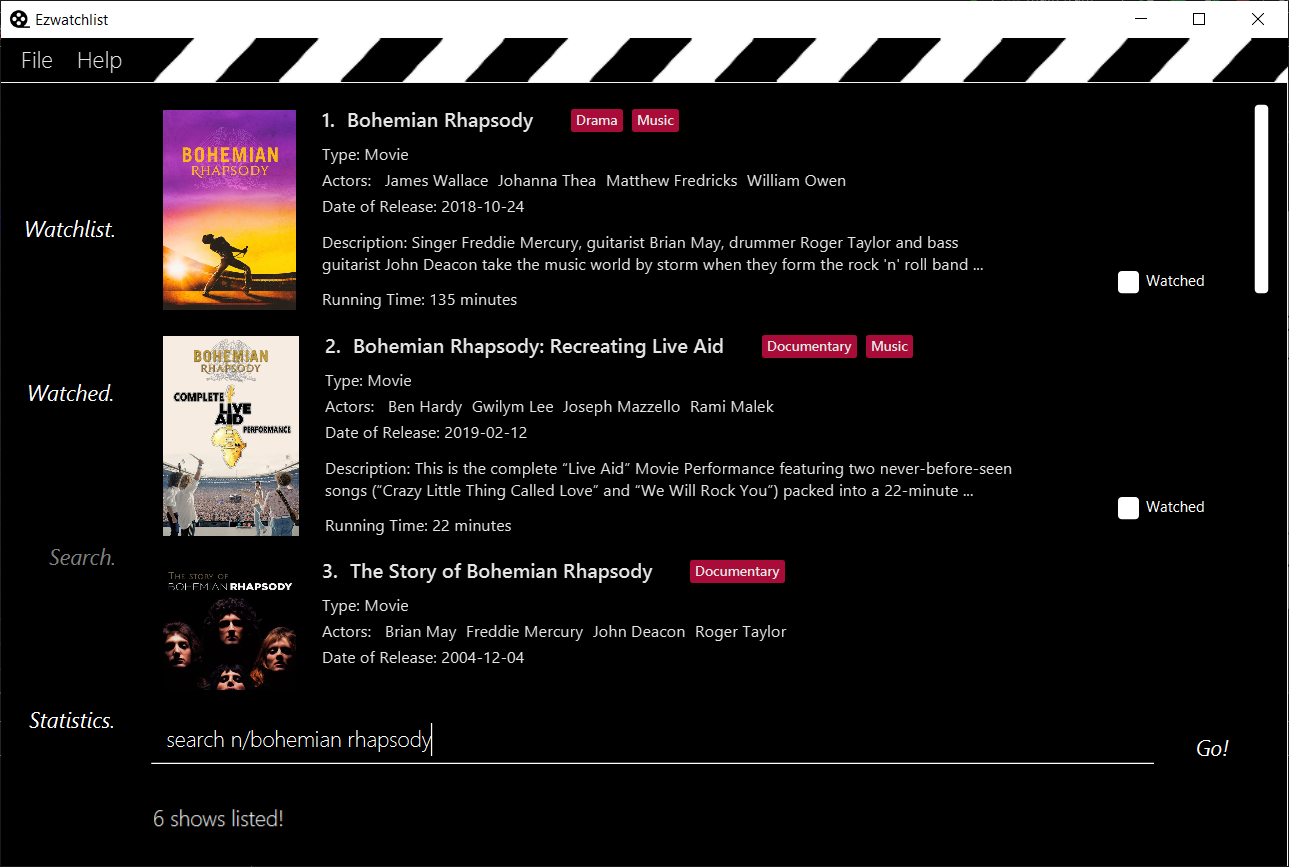
Search Page
The user can navigate to the search page to find a specific movie or television by searching for its name. The user can navigate to this list by clicking the “Search” tab on the side bar or by using the keyboard short-cut 3.
| The search function may require some time to load the data from the API. |
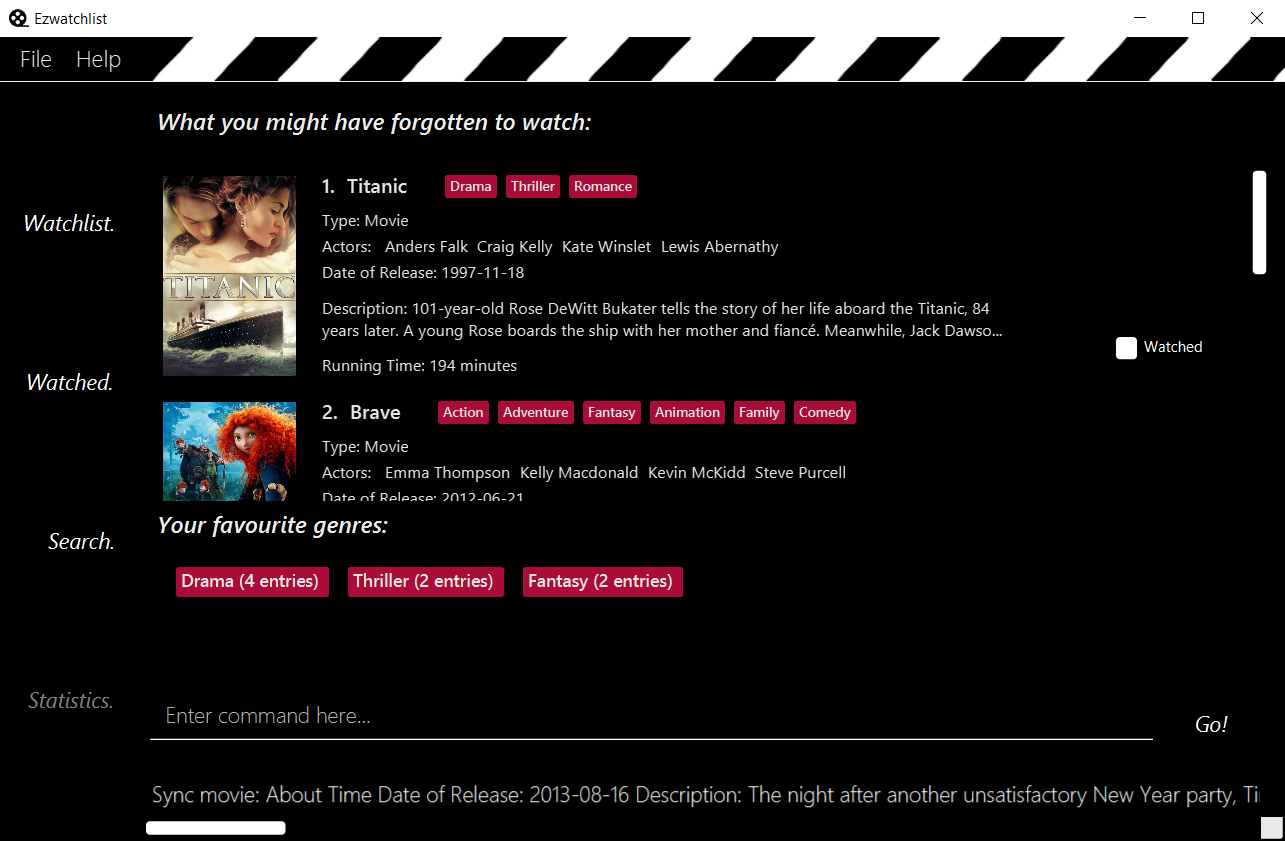
Statistics Page
The user can navigate to the statistics page to find a summary of his watching habits, preferences and history according to what is present in his lists. Examples include:
-
Movies added but might have forgotten to watch
-
Up to 3 most favourite genres
-
Recommendations
The user can navigate to this list by clicking the “Statistics” tab on the side bar or by using the keyboard short-cut 4.
| The statistics function may require some time to load the data from the API the first time you start the application, or after you have made changes to your watchlist. |
Details Page (Coming in v2.0)
Upon clicking a movie or tv show title, a pop-up window will emerge, with a detailed view of the movie or tv show. This page provides the user with more information about the show, like the year, cast and ratings. The user also has the ability to edit the details here.
Contributions to the Developer Guide
Given below are sections I contributed to the Developer Guide. They showcase my ability to write technical documentation and the technical depth of my contributions to the project. |
Statistics Feature
Proposed Implementation
The statistics feature is facilitated by Statistics object. It extends EzWatchlist with a summary of the users' personal
preferences and footprint including the most watched genre, shows that you might have forgotten to watch, and the
recommendations generated for you. It is stored internally as an Statistics object containing a ModelManager.
Additionally, it implements the following operations:
-
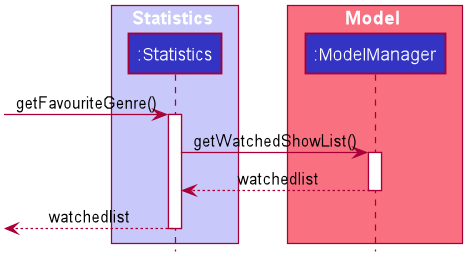
Statistics#getFavouriteGenre()— Gives the genre that appears the most number of times in the list of watched shows. -
Statistics#getForgotten()— Gives the 3 shows that were added the earliest but have not been watched. -
Statistics#getRecommendation()— Gives 3 recommendations according to the watched shows.
Given below is a usage scenario of a user checking his/her statistics page.
Step 1. The user launches the application. The Statistics object will be initialized with ModelManager containing the current watchlist and watched list. Behind the scenes, the 3 statistics will be calculated and the statistics panel will be populated with the result.
Step 2. The user clicks on the statistic button and sees the content.
This is the sequence diagram of getFavouriteGenre().
This is the sequence diagram of getForgotten().
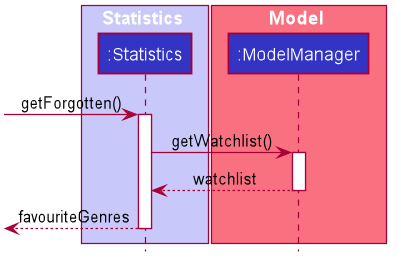
This is the sequence diagram of getRecommendation().
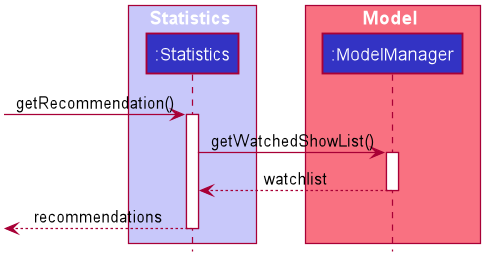
The following activity diagram summarizes the workflow of Statistics:
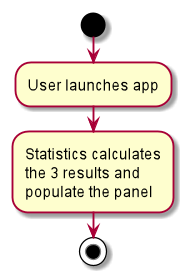
Design Considerations
Aspect: How Statistics stores the watchlist and watched list
-
Alternative 1 (current choice): Saves the whole ModelManager as a field.
-
Pros: Easy to implement and make use of.
-
Cons: More dependency on ModelManager.
-
-
Alternative 2: Saves the watchlist and watched list as fields respectively.
-
Pros: Less dependency on ModelManager.
-
Cons: Less potential functionality and the lists might not be up-to-date.
-
Aspect: When the results are calculated
-
Alternative 1 (current choice): Calculate when the user navigate to Statistics panel and the user has made changes to the watchlist.
-
Pros: Statistics results is more up to date.
-
Cons: Appear less responsive as the API needs to retrieve information during calculation.
-
-
Alternative 2 : Calculate when the application starts and update when there are changes.
-
Pros: It appears more responsive in terms of navigating around the application.
-
Cons: The statistics information will not be updated realtime if the user has changed the watchlist.
-
PROJECT: PowerPointLabs
{Optionally, you may include other projects in your portfolio.}